01
Network Directory
Networks, their features, and other relevant information, organized nationally and by region.
Negotiated rate data across markets, simulated against claims to close gaps in understanding, and clear national tracing of networks with profiles — so payers, providers, and benefits consultants can see the whole board before they sit down at the table.
Network PI
1.00
UHC Choice
0.93
Blue Access
1.02
Cigna OAP
Prices
$1,281
Wtd mean
$405
P10
$798
P25
$1,392
P50
$1,427
P75
$2,042
P90
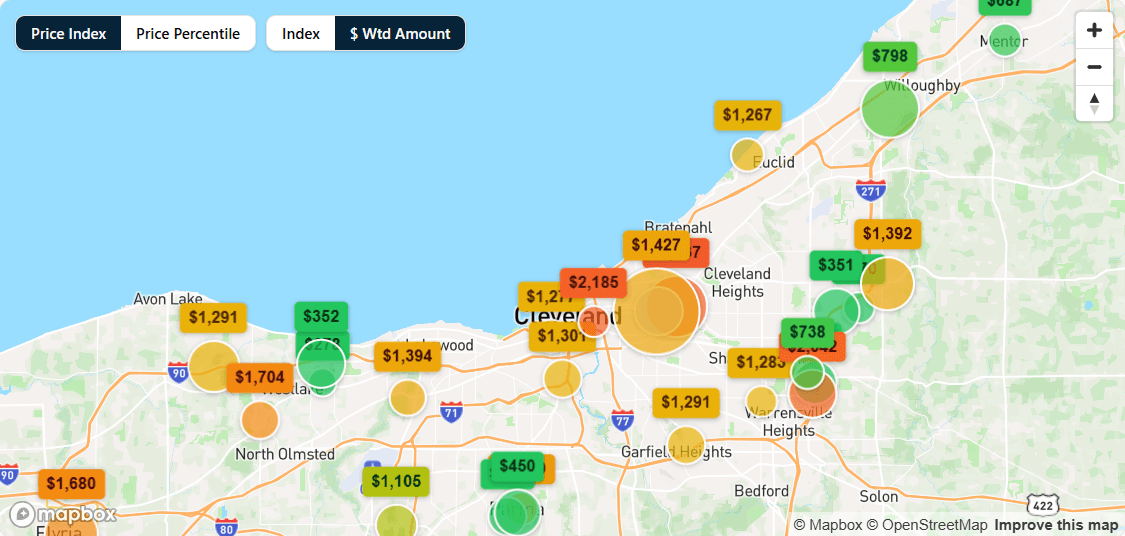
Facilities · by observations
Hospital price transparency files
Thousands of filings, refreshed on publication
Payer machine-readable files
Every major carrier, refreshed monthly
Proprietary Claims Data Set
National Utilization and Claims behind the rates
Primary research and AI extraction
Network attributes filings do not carry
Validate the data
Four sources that can be checked against each other, so an outlier is caught rather than published.
Build bundled and unit pricing
Claims grouped into true units, bundling professional, ancillary, and facility services.
Compare like for like
Deeper insight and more accurate comparisons, because the things being compared are the same shape.
50%
more comparable hospital pricing information than standard rate analysis methods
Built for Benefits Consultants, Payers, and Providers
Networks, their features, and other relevant information, organized nationally and by region.
Compare networks side by side across pricing, overlap, access, and gaps in a given market.
Regional views of networks and comparisons, so you can see how the landscape plays out across specific geographies.
Compare what providers get paid for the same services across code, category, setting, encounter, or overall.
Encounter-level costs across a wide spectrum of common encounters — bundling professional, ancillary, and facility services into a standard unit.
Explore what you care about and export client-ready reports in minutes, without a data request queue.